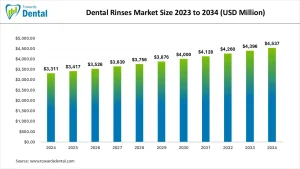
The global dental rinses market was valued at USD 3,311 million in 2024 and is forecasted to reach USD 4,537 million by 2034, growing at a CAGR of 3.2% from 2025 to 2034. This growth is fueled by rising awareness of oral hygiene and increasing consumer demand for effective dental care products.

- Therapeutic Dental Rinses
- Cosmetic Dental Rinses
By Application
- Household
- Hospital & Dental Clinic
| Application | 2024 | 2025 | 2026 | 2027 | 2028 | 2029 | 2030 | 2031 | 2032 | 2033 | 2034 |
| Household | 1,986.60 | 2,050.17 | 2,115.78 | 2,183.48 | 2,253.35 | 2,325.46 | 2,399.87 | 2,476.67 | 2,555.92 | 2,637.71 | 2,722.12 |
| Hospital & Dental Clinic | 1,324.40 | 1,366.78 | 1,410.52 | 1,455.65 | 1,502.24 | 1,550.31 | 1,599.92 | 1,651.11 | 1,703.95 | 1,758.48 | 1,814.75 |
List of Tables
- Table 1: Global Dental Rinses Market Size (USD Million) by Type, 2024–2034
- Table 2: Global Dental Rinses Market Size (USD Million) by Application, 2024–2034
- Table 3: North America Market Size (USD Million) by Type, 2024–2034
- Table 4: North America Market Size (USD Million) by Application, 2024–2034
- Table 5: U.S. Market Size (USD Million) by Type & Application, 2024–2034
- Table 6: Canada Market Size (USD Million) by Type & Application, 2024–2034
- Table 7: Mexico Market Size (USD Million) by Type & Application, 2024–2034
- Table 8: Europe Market Size (USD Million) by Type, 2024–2034
- Table 9: Europe Market Size (USD Million) by Application, 2024–2034
- Table 10: Germany Market Size (USD Million) by Type & Application, 2024–2034
- Table 11: France Market Size (USD Million) by Type & Application, 2024–2034
- Table 12: UK Market Size (USD Million) by Type & Application, 2024–2034
- Table 13: Italy Market Size (USD Million) by Type & Application, 2024–2034
- Table 14: Asia Pacific Market Size (USD Million) by Type, 2024–2034
- Table 15: Asia Pacific Market Size (USD Million) by Application, 2024–2034
- Table 16: China Market Size (USD Million) by Type & Application, 2024–2034
- Table 17: Japan Market Size (USD Million) by Type & Application, 2024–2034
- Table 18: India Market Size (USD Million) by Type & Application, 2024–2034
- Table 19: South Korea Market Size (USD Million) by Type & Application, 2024–2034
- Table 20: Southeast Asia Market Size (USD Million) by Type & Application, 2024–2034
- Table 21: Latin America Market Size (USD Million) by Type & Application, 2024–2034
- Table 22: Brazil Market Size (USD Million) by Type & Application, 2024–2034
- Table 23: Middle East & Africa Market Size (USD Million) by Type & Application, 2024–2034
- Table 24: GCC Countries Market Size (USD Million) by Type & Application, 2024–2034
- Table 25: Turkey Market Size (USD Million) by Type & Application, 2024–2034
- Table 26: Africa Market Size (USD Million) by Type & Application, 2024–2034
List of Figures
- Figure 1: Global Market Share by Type, 2024
- Figure 2: Global Market Share by Application, 2024
- Figure 3: North America Market Share by Type, 2024
- Figure 4: North America Market Share by Application, 2024
- Figure 5: U.S. Market Share by Type, 2024
- Figure 6: U.S. Market Share by Application, 2024
- Figure 7: Canada Market Share by Type, 2024
- Figure 8: Canada Market Share by Application, 2024
- Figure 9: Mexico Market Share by Type, 2024
- Figure 10: Mexico Market Share by Application, 2024
- Figure 11: Europe Market Share by Type, 2024
- Figure 12: Europe Market Share by Application, 2024
- Figure 13: Germany Market Share by Type, 2024
- Figure 14: Germany Market Share by Application, 2024
- Figure 15: France Market Share by Type, 2024
- Figure 16: France Market Share by Application, 2024
- Figure 17: UK Market Share by Type, 2024
- Figure 18: UK Market Share by Application, 2024
- Figure 19: Italy Market Share by Type, 2024
- Figure 20: Italy Market Share by Application, 2024
- Figure 21: Asia Pacific Market Share by Type, 2024
- Figure 22: Asia Pacific Market Share by Application, 2024
- Figure 23: China Market Share by Type, 2024
- Figure 24: China Market Share by Application, 2024
- Figure 25: Japan Market Share by Type, 2024
- Figure 26: Japan Market Share by Application, 2024
- Figure 27: India Market Share by Type, 2024
- Figure 28: India Market Share by Application, 2024
- Figure 29: South Korea Market Share by Type, 2024
- Figure 30: South Korea Market Share by Application, 2024
- Figure 31: Southeast Asia Market Share by Type, 2024
- Figure 32: Southeast Asia Market Share by Application, 2024
- Figure 33: Latin America Market Share by Type, 2024
- Figure 34: Latin America Market Share by Application, 2024
- Figure 35: Brazil Market Share by Type, 2024
- Figure 36: Brazil Market Share by Application, 2024
- Figure 37: Middle East & Africa Market Share by Type, 2024
- Figure 38: Middle East & Africa Market Share by Application, 2024
- Figure 39: GCC Countries Market Share by Type, 2024
- Figure 40: GCC Countries Market Share by Application, 2024
- Figure 41: Turkey Market Share by Type, 2024
- Figure 42: Turkey Market Share by Application, 2024
- Figure 43: Africa Market Share by Type, 2024
- Figure 44: Africa Market Share by Application, 2024
- Dental Tools and Equipment Market Size to Attain USD 1,1723 Million by 2034 - October 8, 2025
- Dental Equipment Market Size to Surpass USD 7,900 Million by 2034 - October 8, 2025
- Dental Inlays Market Size is USD 2,287 Million in 2025 - October 8, 2025