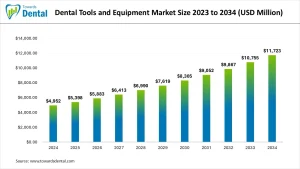
The dental tools and equipment market is anticipated to grow from USD 4,952 million in 2024 to approximately USD 11,723 million by 2034, registering a robust CAGR of 9%. This expansion is fueled by rising dental healthcare needs and technological advancements in dental treatments.

- Examination Instruments
- Restorative Instruments
- Periodontal Instruments
- Prosthodontic Instruments
- Extraction Instruments
- Endodontic Instruments
By Application
- Hospitals
- Dental Clinics
- Laboratory
- Others
List of Tables
- Table 1: Global Dental Tools and Equipment Market Size (USD Million) by Type, 2024–2034
- Table 2: Global Dental Tools and Equipment Market Size (USD Million) by Application, 2024–2034
- Table 3: North America Market Size (USD Million) by Type, 2024–2034
- Table 4: North America Market Size (USD Million) by Application, 2024–2034
- Table 5: U.S. Market Size (USD Million) by Type & Application, 2024–2034
- Table 6: Canada Market Size (USD Million) by Type & Application, 2024–2034
- Table 7: Mexico Market Size (USD Million) by Type & Application, 2024–2034
- Table 8: Europe Market Size (USD Million) by Type, 2024–2034
- Table 9: Europe Market Size (USD Million) by Application, 2024–2034
- Table 10: Germany Market Size (USD Million) by Type & Application, 2024–2034
- Table 11: France Market Size (USD Million) by Type & Application, 2024–2034
- Table 12: UK Market Size (USD Million) by Type & Application, 2024–2034
- Table 13: Italy Market Size (USD Million) by Type & Application, 2024–2034
- Table 14: Asia Pacific Market Size (USD Million) by Type, 2024–2034
- Table 15: Asia Pacific Market Size (USD Million) by Application, 2024–2034
- Table 16: China Market Size (USD Million) by Type & Application, 2024–2034
- Table 17: Japan Market Size (USD Million) by Type & Application, 2024–2034
- Table 18: India Market Size (USD Million) by Type & Application, 2024–2034
- Table 19: South Korea Market Size (USD Million) by Type & Application, 2024–2034
- Table 20: Southeast Asia Market Size (USD Million) by Type & Application, 2024–2034
- Table 21: Latin America Market Size (USD Million) by Type & Application, 2024–2034
- Table 22: Brazil Market Size (USD Million) by Type & Application, 2024–2034
- Table 23: Middle East & Africa Market Size (USD Million) by Type & Application, 2024–2034
- Table 24: GCC Countries Market Size (USD Million) by Type & Application, 2024–2034
- Table 25: Turkey Market Size (USD Million) by Type & Application, 2024–2034
- Table 26: Africa Market Size (USD Million) by Type & Application, 2024–2034
List of Figures
- Figure 1: Global Market Share by Type, 2024
- Figure 2: Global Market Share by Application, 2024
- Figure 3: North America Market Share by Type, 2024
- Figure 4: North America Market Share by Application, 2024
- Figure 5: U.S. Market Share by Type, 2024
- Figure 6: U.S. Market Share by Application, 2024
- Figure 7: Canada Market Share by Type, 2024
- Figure 8: Canada Market Share by Application, 2024
- Figure 9: Mexico Market Share by Type, 2024
- Figure 10: Mexico Market Share by Application, 2024
- Figure 11: Europe Market Share by Type, 2024
- Figure 12: Europe Market Share by Application, 2024
- Figure 13: Germany Market Share by Type, 2024
- Figure 14: Germany Market Share by Application, 2024
- Figure 15: France Market Share by Type, 2024
- Figure 16: France Market Share by Application, 2024
- Figure 17: UK Market Share by Type, 2024
- Figure 18: UK Market Share by Application, 2024
- Figure 19: Italy Market Share by Type, 2024
- Figure 20: Italy Market Share by Application, 2024
- Figure 21: Asia Pacific Market Share by Type, 2024
- Figure 22: Asia Pacific Market Share by Application, 2024
- Figure 23: China Market Share by Type, 2024
- Figure 24: China Market Share by Application, 2024
- Figure 25: Japan Market Share by Type, 2024
- Figure 26: Japan Market Share by Application, 2024
- Figure 27: India Market Share by Type, 2024
- Figure 28: India Market Share by Application, 2024
- Figure 29: South Korea Market Share by Type, 2024
- Figure 30: South Korea Market Share by Application, 2024
- Figure 31: Southeast Asia Market Share by Type, 2024
- Figure 32: Southeast Asia Market Share by Application, 2024
- Figure 33: Latin America Market Share by Type, 2024
- Figure 34: Latin America Market Share by Application, 2024
- Figure 35: Brazil Market Share by Type, 2024
- Figure 36: Brazil Market Share by Application, 2024
- Figure 37: Middle East & Africa Market Share by Type, 2024
- Figure 38: Middle East & Africa Market Share by Application, 2024
- Figure 39: GCC Countries Market Share by Type, 2024
- Figure 40: GCC Countries Market Share by Application, 2024
- Figure 41: Turkey Market Share by Type, 2024
- Figure 42: Turkey Market Share by Application, 2024
- Figure 43: Africa Market Share by Type, 2024
- Figure 44: Africa Market Share by Application, 2024
- Dental Tools and Equipment Market Size to Attain USD 1,1723 Million by 2034 - October 8, 2025
- Dental Equipment Market Size to Surpass USD 7,900 Million by 2034 - October 8, 2025
- Dental Inlays Market Size is USD 2,287 Million in 2025 - October 8, 2025