Dental Services Organization Market Size to Surpass USD 833.96 Billion by 2034

Dental Services Organization Market (By Service: Human Resources, Medical Supplies Procurement, Marketing, Accounting, and Legal Services; By End User: General Dentists, Dental Surgeons, Orthodontists, Endodontists, and Oral Surgeons; By Practice Size: Solo Practices, Small Groups, Large Groups, and Multi-location Networks; By Ownership Model: Private Equity, Corporate, Partnership, and Independent DSOs; By Region: North America, Europe, Asia-Pacific, Latin America, and Middle East & Africa) Industry Size, Share, Growth, Trends 2025 to 2034

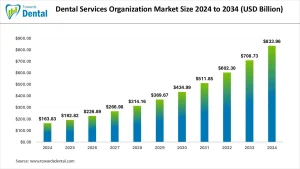
The global dental services organization market was valued at USD 163.83 billion in 2024 and is expected to reach USD 833.96 billion by 2034, growing at a CAGR of 17.67%, driven by rising demand for organized dental care and advanced oral health solutions.

Dental Services Organization Market

Dental Services Organization Market Statical Scope

Reports Attributes Statistics
Market Size in 2024 USD 163.83 Billion
Market Size in 2025 USD 192.82 Billion
Market Size in 2031 USD 511.85 Billion
Market Size by 2034 USD 833.96 Billion
CAGR 2025 to 2034 17.67%
Base Year 2024
Forecast Period 2025 to 2034

How Big is the Dental Service Organizations Market?

Market dynamics reflect fundamental shifts in dental practice ownership and management philosophies. Approximately 2,000 DSOs operate across the United States currently, representing a dramatic expansion from just 100 organizations in 2010. Private equity investment fuels much of this growth, with consolidation activity exceeding USD 9 billion in 2024 as investors recognize dental market stability and scalability potential.

Author’s briefing on the Market Size, “Private equity consolidation and workforce demographic shifts suggest that technology integration and multi-state operational models may define revenue consistency in the forecast horizon.”

Dental Service Organizations Market — Strategic Interpretation

  • Market Size and Forecast: Global DSO market advances from USD 192.8B (2025) to USD 835.87B (2034), maintaining 17.65% CAGR through practice consolidation and operational efficiency advantages.
  • Consolidation Dynamics: DSO count expanded from 100 (2010) to 2,000+ (2025), driven by private equity investment exceeding USD 9B in 2024 and practice ownership transitions.
  • Practitioner Adoption: Approximately 10.4% of American dentists affiliate with DSOs, attracted by reduced administrative burden and improved work-life balance.
  • Technology Leadership: Leading DSOs differentiate through AI-powered diagnostics, centralized data management, and enterprise-scale practice management systems.

Top Drivers, Trends, and Challenges in Dental Service Organizations Market

How do economic pressures drive dental practice consolidation into DSO models?

Economic pressures create compelling reasons for independent dental practices to seek DSO affiliation or acquisition. Rising operational costs, including staff wages, equipment expenses, and regulatory compliance requirements, strain individual practice profitability. DSOs achieve economies of scale through centralized purchasing power, negotiating supply costs 15-20% below individual practice rates according to industry analyses. Administrative burden reduction allows dentists to focus on clinical care rather than business management, potentially increasing treatment capacity and revenue generation. Technology investments requiring substantial capital become accessible through DSO affiliation, allowing smaller practices to utilize advanced diagnostic equipment and practice management software that would otherwise be financially prohibitive.

What role do demographic trends play in accelerating DSO market expansion?

Demographic shifts fundamentally reshape dental practice ownership patterns and market demand structures. Aging dental workforce creates substantial practice transition opportunities as baby boomer dentists approach retirement without clear succession plans. Approximately 23% of practicing dentists are over 60, representing thousands of potential practice sales or transitions. Younger dental graduates, burdened with average student debt exceeding USD 250,000, increasingly favor employment arrangements over practice ownership responsibilities. DSOs provide immediate employment opportunities with competitive compensation, benefits, and career development support that individual practices struggle to match. Patient demographics drive treatment demand, with aging populations requiring complex restorative procedures that DSOs can deliver efficiently.

How does private equity investment influence DSO market dynamics?

Private equity capital transforms DSO market dynamics through substantial investment, allowing rapid expansion and operational improvements. Investment exceeding USD 9 billion in 2024 reflects investor confidence in dental market stability and scalability potential. Private equity groups provide capital for practice acquisitions, technology investments, and geographic expansion strategies that accelerate market consolidation. Professional management expertise from private equity partnerships enhances DSO operational capabilities through sophisticated business processes and strategic planning. Exit strategies through public offerings or strategic sales create liquidity events that attract continued investment capital.

Dental Service Organizations Market Segmentation Analysis

Segment Group Leading Segment (2035, % share) Historical (pre-2025) Current (2025) Forecast (2035)
Service Medical Supplies Procurement (~35%) Medium High High
End User General Dentists (~60%) High High High
Practice Size Small Groups (~40%) Low Medium High
Ownership Model Private Equity (~45%) Low High High
Geographic Scope Multi-state Operations (~50%) Low Medium High

Which service category shows the strongest market penetration?

Medical supplies procurement dominates DSO service offerings (35% market share by 2035) driven by significant cost savings opportunities through centralized purchasing power. DSOs negotiate volume discounts with dental suppliers, equipment manufacturers, and pharmaceutical companies that individual practices cannot achieve independently. Procurement services extend beyond basic supplies to include expensive equipment like digital imaging systems and advanced diagnostic tools. DSOs often secure 15-20% cost reductions compared to independent practice purchasing, creating immediate value for affiliated dentists. Human resources services show rapid growth as DSOs provide comprehensive HR support, including recruiting, benefits administration, and compliance management.

Which end user segment generates the highest adoption rates?

General dentists represent 60% of DSO market demand by 2035, reflecting the segment’s size within dental practice demographics and operational support needs. General dentistry comprises approximately 80% of all dental practices, creating a substantial addressable market for DSO services. These practitioners benefit significantly from administrative support, allowing focus on patient care, while DSOs handle business operations. Dental surgeons show the fastest growth rates due to increasing demand for complex restorative procedures and surgical interventions. Specialist practices, including orthodontists and endodontists, show growing DSO adoption as they seek operational efficiency and practice management expertise.

Which practice size category shows the strongest affiliation patterns?

Small group practices comprising 2-5 dentists represent 40% of DSO affiliations by 2035, balancing operational complexity with management efficiency needs. These practices require sophisticated business support, maintaining clinical autonomy, and personalized patient relationships. Solo practitioners increasingly seek DSO affiliation to access technology, reduce administrative burden, and improve work-life balance without losing practice identity. Large group practices and multi-location networks benefit from DSO scalability and standardized operations across multiple sites. Growth potential remains highest among small to medium practices that lack internal business management capabilities.

Which ownership model shows the strongest market performance?

Private equity-backed DSOs command a 45% market share by 2035 through substantial investment capital, allowing rapid expansion and operational improvements. Private equity groups provide financial resources for practice acquisitions, technology investments, and geographic expansion that accelerate market penetration. Professional management expertise from institutional investors enhances DSO operational capabilities and strategic planning. Corporate DSOs maintain a steady market presence through established operational systems and brand recognition. Partnership models between dentists and management companies create hybrid structures balancing clinical control with business expertise.

Which geographic scope strategy shows the greatest effectiveness?

Multi-state operations represent 50% of leading DSO strategies by 2035, allowing economies of scale, diversifying regulatory and market risks across jurisdictions. National DSO brands like Aspen Dental and Pacific Dental Services show scalability advantages through standardized operations and centralized management systems. Regional concentration strategies allow deep market penetration and operational efficiency within specific geographic areas. Multi-state expansion requires regulatory compliance across different jurisdictions, maintaining operational consistency. Geographic diversification reduces market risk, creating opportunities for practice acquisition and organic growth.

Dental Service Organizations Market Regional Analysis

North America — How do market maturity and regulatory frameworks support DSO expansion?

North America generates 34% of the global DSO market revenue through established healthcare infrastructure, favorable reimbursement systems, and advanced technology adoption. The United States leads with approximately 2,000 active DSOs serving diverse practice sizes and specialties across multiple states. Regulatory frameworks generally support DSO operations, maintaining professional practice standards through licensing requirements and clinical oversight protocols. Private equity investment exceeding USD 4 billion annually drives continued consolidation as investors recognize dental market stability and growth potential. Canadian markets show growing DSO adoption as practitioners seek operational support and improved practice efficiency.

Europe — What regulatory frameworks influence DSO market development?

European DSO markets develop within diverse regulatory frameworks and healthcare funding systems that create unique operational challenges and opportunities. United Kingdom private dental markets support DSO growth as NHS capacity constraints drive patient demand toward private practice alternatives. Germany’s mixed public-private healthcare system creates opportunities for DSO expansion in cosmetic and elective dental procedures. Regulatory harmonization across European Union member states helps cross-border DSO operations and professional mobility. Colosseum Dental represents European DSO success through multi-country operations and standardized care protocols.

Asia Pacific — How do emerging dental markets create DSO expansion opportunities?

Asia-Pacific represents the fastest-growing DSO market region through expanding middle-class populations, increasing healthcare expenditures, and modernizing dental care infrastructure. Japan leads regional DSO adoption through aging demographics requiring complex dental care and established private practice networks. Australia and New Zealand show mature DSO markets with regulatory frameworks supporting corporate practice models. China presents substantial long-term opportunities through healthcare infrastructure development and growing dental care awareness. India shows emerging DSO activity as dental education expansion creates practitioner supply seeking operational support.

Latin America — What emerging market characteristics influence DSO development?

Latin American DSO markets show early-stage development driven by healthcare modernization initiatives and expanding dental education programs. Brazil leads regional activity through established private dental networks and growing middle-class populations seeking quality dental care. Mexico benefits from medical tourism and proximity to North American markets, creating cross-border DSO opportunities. Government healthcare initiatives in several countries create standardized care requirements that favor organized delivery systems. Economic development supports healthcare infrastructure investment and technology adoption that allows DSO operational models.

Middle East and Africa — How do infrastructure investments create market development potential?

The Middle East and Africa regions show early-stage DSO market development with substantial long-term growth potential driven by healthcare infrastructure investment and demographic transitions. UAE and Saudi Arabia lead adoption through government healthcare initiatives and expatriate population dental care requirements. South Africa maintains established private dental networks that support DSO development and operational efficiency improvements. Government initiatives promoting healthcare sector development create favorable conditions for organized dental delivery systems. Regional economic diversification includes healthcare sector development, creating opportunities for DSO market expansion.

Competitive Landscape in the Dental Service Organizations Market

What percentage of dental practices affiliate with DSO structures?

Current market analysis indicates approximately 10.4% of American dentists affiliate with DSO structures, representing significant growth from a minimal presence just two decades ago. Independent practice ownership remains dominant at roughly 85-90% of practitioners, though affiliation rates increase steadily as operational pressures and market dynamics favor organized delivery systems. DSO penetration varies significantly by practice size, with smaller solo practices showing lower affiliation rates compared to group practices seeking operational support. Geographic variations exist, with urban markets showing higher DSO penetration compared to rural areas where independent practice traditions remain strong.

How do leading DSOs differentiate through service portfolios and technology?

Market leaders establish competitive advantages through comprehensive service portfolios addressing diverse practice management needs beyond basic administrative support. Aspen Dental differentiates through consumer-focused marketing, standardized treatment protocols, and aggressive geographic expansion strategies. Pacific Dental Services emphasizes technology integration, advanced training programs, and sophisticated business intelligence systems. Heartland Dental focuses on practice acquisition and operational excellence, maintaining local practice identity and autonomy. Technology differentiation includes AI-powered diagnostic systems, advanced practice management platforms, and integrated patient communication systems.

What strategic partnerships emerge between DSOs and technology companies?

Strategic partnerships create integrated ecosystems supporting DSO growth and operational capabilities across multiple business functions. Technology partnerships with companies like VideaHealth allow AI-powered diagnostic capabilities across multi-practice networks. Financial services partnerships provide practice acquisition financing, equipment leasing, and working capital solutions supporting DSO expansion strategies. Supply chain partnerships with dental manufacturers and distributors create preferential pricing and inventory management systems. Insurance partnerships help with preferred provider agreements and streamlined reimbursement processes.

Dental Services Organization Market Companies:

  • Affinity Dental Management
  • Aspen Dental
  • Colosseum Dental Group AS
  • Dykema
  • Heartland Dental
  • MB2 Dental
  • Overjet
  • Parkview Dental Partners
  • Sage Dental
  • Smile Brands, Inc.
  • Straine Dental Management
  • VideaHealth

Top Industry News

  • In March 2025, Parkview Dental Partners announced acquisition of periodontics practice in Brandon, Florida, expanding regional footprint and specialty service capabilities within the Florida market through Dr. Douglas C. Wendt, Jr. partnership. (Source: Parkview Dental Communications)
  • During January 2025, VideaHealth raised USD 40 million in Series B funding to revolutionize DSO operations through AI technology, focusing on successful partnerships and broadening product offerings across various dental segments. (Source: VideaHealth Press Release)
  • In February 2025, Straine Dental Management announced collaboration with Arkansas dentist Scott Jolly, DDS, to acquire new dental practice in Arkansas, showing continued DSO expansion in underserved markets. (Source: SDM Communications)
  • Throughout 2024, Patient Square Capital completed USD 4.1 billion acquisition of Patterson Companies, signaling major private equity confidence in dental services sector consolidation and supply chain integration opportunities. (Source: Healthcare Investment News)

Dental Services Organization Market Segmentation:

By Service

  • Human Resources
  • Medical Supplies Procurement
  • Marketing
  • Accounting
  • Legal Services

By End User

  • General Dentists
  • Dental Surgeons
  • Orthodontists
  • Endodontists
  • Oral Surgeons

By Practice Size

  • Solo Practices
  • Small Groups
  • Large Groups
  • Multi-location Networks

By Ownership Model

  • Private Equity
  • Corporate
  • Partnership
  • Independent DSOs

By Region

  • North America
  • Europe
  • Asia-Pacific
  • Latin America
  • Middle East and Africa

Market Size

Dental Services Organization Market Size By Region 2025 to 2034 (USD Billion)

Region 2024 2025 2026 2027 2028 2029 2030 2031 2032 2033 2034
North America         65.53         77.11         90.74      106.77      125.64      147.84      173.96      204.70      240.87      283.43      333.51
Asia Pacific         32.77         38.56         45.37         53.39         62.82         73.92         86.98      102.35      120.43      141.71      166.76
Europe         40.96         48.19         56.71         66.73         78.52         92.40      108.72      127.94      150.54      177.14      208.44
LAMEA         24.57         28.92         34.03         40.04         47.11         55.44         65.23         76.76         90.33      106.29      125.07

Dental Services Organization Market Size By Service 2025 to 2034 (USD Billion)

Service 2024 2025 2026 2027 2028 2029 2030 2031 2032 2033 2034
Human Resources         32.77         38.56         45.37         53.39         62.82         73.92         86.98      102.35      120.43      141.71      166.76
Medical Supplies Procurement         24.57         28.92         34.03         40.04         47.11         55.44         65.23         76.76         90.33      106.29      125.07
Marketing         40.96         48.19         56.71         66.73         78.52         92.40      108.72      127.94      150.54      177.14      208.44
Accounting         24.57         28.92         34.03         40.04         47.11         55.44         65.23         76.76         90.33      106.29      125.07
Legal Services         40.96         48.19         56.71         66.73         78.52         92.40      108.72      127.94      150.54      177.14      208.44

List of Table and Figure

List of Tables

  • Table 1: Global Dental Services Organization Market Size (USD Billion) by Service, 2024–2034
  • Table 2: Global Dental Services Organization Market Size (USD Billion) by End User, 2024–2034
  • Table 3: Global Dental Services Organization Market Size (USD Billion) by Practice Size, 2024–2034
  • Table 4: Global Dental Services Organization Market Size (USD Billion) by Ownership Model, 2024–2034
  • Table 5: North America Dental Services Organization Market Size (USD Billion) by Service, 2024–2034
  • Table 6: North America Dental Services Organization Market Size (USD Billion) by End User, 2024–2034
  • Table 7: North America Dental Services Organization Market Size (USD Billion) by Practice Size, 2024–2034
  • Table 8: North America Dental Services Organization Market Size (USD Billion) by Ownership Model, 2024–2034
  • Table 9: U.S. Dental Services Organization Market Size (USD Billion) by Service & End User, 2024–2034
  • Table 10: Canada Dental Services Organization Market Size (USD Billion) by Service & End User, 2024–2034
  • Table 11: Mexico Dental Services Organization Market Size (USD Billion) by Service & End User, 2024–2034
  • Table 12: Europe Dental Services Organization Market Size (USD Billion) by Service, 2024–2034
  • Table 13: Europe Dental Services Organization Market Size (USD Billion) by End User, 2024–2034
  • Table 14: Germany Dental Services Organization Market Size (USD Billion) by Service & End User, 2024–2034
  • Table 15: France Dental Services Organization Market Size (USD Billion) by Service & End User, 2024–2034
  • Table 16: UK Dental Services Organization Market Size (USD Billion) by Service & End User, 2024–2034
  • Table 17: Italy Dental Services Organization Market Size (USD Billion) by Service & End User, 2024–2034
  • Table 18: Asia Pacific Dental Services Organization Market Size (USD Billion) by Service, 2024–2034
  • Table 19: Asia Pacific Dental Services Organization Market Size (USD Billion) by End User, 2024–2034
  • Table 20: China Dental Services Organization Market Size (USD Billion) by Service & End User, 2024–2034
  • Table 21: Japan Dental Services Organization Market Size (USD Billion) by Service & End User, 2024–2034
  • Table 22: India Dental Services Organization Market Size (USD Billion) by Service & End User, 2024–2034
  • Table 23: South Korea Dental Services Organization Market Size (USD Billion) by Service & End User, 2024–2034
  • Table 24: Southeast Asia Dental Services Organization Market Size (USD Billion) by Service & End User, 2024–2034
  • Table 25: Latin America Dental Services Organization Market Size (USD Billion) by Service & End User, 2024–2034
  • Table 26: Brazil Dental Services Organization Market Size (USD Billion) by Service & End User, 2024–2034
  • Table 27: Middle East & Africa Dental Services Organization Market Size (USD Billion) by Service & End User, 2024–2034
  • Table 28: GCC Countries Dental Services Organization Market Size (USD Billion) by Service & End User, 2024–2034
  • Table 29: Turkey Dental Services Organization Market Size (USD Billion) by Service & End User, 2024–2034
  • Table 30: Africa Dental Services Organization Market Size (USD Billion) by Service & End User, 2024–2034

List of Figures

  • Figure 1: Global Dental Services Organization Market Share by Service, 2024
  • Figure 2: Global Dental Services Organization Market Share by End User, 2024
  • Figure 3: Global Dental Services Organization Market Share by Practice Size, 2024
  • Figure 4: Global Dental Services Organization Market Share by Ownership Model, 2024
  • Figure 5: North America Dental Services Organization Market Share by Service, 2024
  • Figure 6: North America Dental Services Organization Market Share by End User, 2024
  • Figure 7: North America Dental Services Organization Market Share by Practice Size, 2024
  • Figure 8: North America Dental Services Organization Market Share by Ownership Model, 2024
  • Figure 9: U.S. Dental Services Organization Market Share by Service, 2024
  • Figure 10: U.S. Dental Services Organization Market Share by End User, 2024
  • Figure 11: Canada Dental Services Organization Market Share by Service, 2024
  • Figure 12: Canada Dental Services Organization Market Share by End User, 2024
  • Figure 13: Mexico Dental Services Organization Market Share by Service, 2024
  • Figure 14: Mexico Dental Services Organization Market Share by End User, 2024
  • Figure 15: Europe Dental Services Organization Market Share by Service, 2024
  • Figure 16: Europe Dental Services Organization Market Share by End User, 2024
  • Figure 17: Germany Dental Services Organization Market Share by Service, 2024
  • Figure 18: Germany Dental Services Organization Market Share by End User, 2024
  • Figure 19: France Dental Services Organization Market Share by Service, 2024
  • Figure 20: France Dental Services Organization Market Share by End User, 2024
  • Figure 21: UK Dental Services Organization Market Share by Service, 2024
  • Figure 22: UK Dental Services Organization Market Share by End User, 2024
  • Figure 23: Italy Dental Services Organization Market Share by Service, 2024
  • Figure 24: Italy Dental Services Organization Market Share by End User, 2024
  • Figure 25: Asia Pacific Dental Services Organization Market Share by Service, 2024
  • Figure 26: Asia Pacific Dental Services Organization Market Share by End User, 2024
  • Figure 27: China Dental Services Organization Market Share by Service, 2024
  • Figure 28: China Dental Services Organization Market Share by End User, 2024
  • Figure 29: Japan Dental Services Organization Market Share by Service, 2024
  • Figure 30: Japan Dental Services Organization Market Share by End User, 2024
  • Figure 31: India Dental Services Organization Market Share by Service, 2024
  • Figure 32: India Dental Services Organization Market Share by End User, 2024
  • Figure 33: South Korea Dental Services Organization Market Share by Service, 2024
  • Figure 34: South Korea Dental Services Organization Market Share by End User, 2024
  • Figure 35: Southeast Asia Dental Services Organization Market Share by Service, 2024
  • Figure 36: Southeast Asia Dental Services Organization Market Share by End User, 2024
  • Figure 37: Latin America Dental Services Organization Market Share by Service, 2024
  • Figure 38: Latin America Dental Services Organization Market Share by End User, 2024
  • Figure 39: Brazil Dental Services Organization Market Share by Service, 2024
  • Figure 40: Brazil Dental Services Organization Market Share by End User, 2024
  • Figure 41: Middle East & Africa Dental Services Organization Market Share by Service, 2024
  • Figure 42: Middle East & Africa Dental Services Organization Market Share by End User, 2024
  • Figure 43: GCC Countries Dental Services Organization Market Share by Service, 2024
  • Figure 44: GCC Countries Dental Services Organization Market Share by End User, 2024
  • Figure 45: Turkey Dental Services Organization Market Share by Service, 2024
  • Figure 46: Turkey Dental Services Organization Market Share by End User, 2024
  • Figure 47: Africa Dental Services Organization Market Share by Service, 2024
  • Figure 48: Africa Dental Services Organization Market Share by End User, 2024
Rohan Patil

Author

Scroll to Top