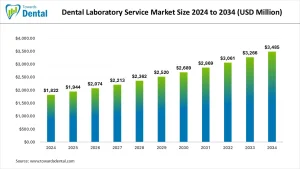
The dental laboratory service market was valued at USD 1,822 million in 2024 and is forecasted to reach USD 3,485 million by 2034, growing at a CAGR of 6.7%. This growth is attributed to the rising demand for advanced dental solutions and technological innovations in dental labs.
Dental Laboratory Service Market Statical Scope
By Type
- Fixed Restorative Dental Laboratory Service
- Active Restorative Dental Laboratory Service
- Orthodontic Dental Laboratory Service
- Others
By Application
- Clinical
- Scientific Research
List of Table and Figure
List of Tables
- Table 1: Global Dental Laboratory Service Market Size (USD Million) by Type, 2024–2034
- Table 2: Global Dental Laboratory Service Market Size (USD Million) by Application, 2024–2034
- Table 3: North America Market Size (USD Million) by Type, 2024–2034
- Table 4: North America Market Size (USD Million) by Application, 2024–2034
- Table 5: U.S. Market Size (USD Million) by Type & Application, 2024–2034
- Table 6: Canada Market Size (USD Million) by Type & Application, 2024–2034
- Table 7: Mexico Market Size (USD Million) by Type & Application, 2024–2034
- Table 8: Europe Market Size (USD Million) by Type, 2024–2034
- Table 9: Europe Market Size (USD Million) by Application, 2024–2034
- Table 10: Germany Market Size (USD Million) by Type & Application, 2024–2034
- Table 11: France Market Size (USD Million) by Type & Application, 2024–2034
- Table 12: UK Market Size (USD Million) by Type & Application, 2024–2034
- Table 13: Italy Market Size (USD Million) by Type & Application, 2024–2034
- Table 14: Asia Pacific Market Size (USD Million) by Type, 2024–2034
- Table 15: Asia Pacific Market Size (USD Million) by Application, 2024–2034
- Table 16: China Market Size (USD Million) by Type & Application, 2024–2034
- Table 17: Japan Market Size (USD Million) by Type & Application, 2024–2034
- Table 18: India Market Size (USD Million) by Type & Application, 2024–2034
- Table 19: South Korea Market Size (USD Million) by Type & Application, 2024–2034
- Table 20: Southeast Asia Market Size (USD Million) by Type & Application, 2024–2034
- Table 21: Latin America Market Size (USD Million) by Type & Application, 2024–2034
- Table 22: Brazil Market Size (USD Million) by Type & Application, 2024–2034
- Table 23: Middle East & Africa Market Size (USD Million) by Type & Application, 2024–2034
- Table 24: GCC Countries Market Size (USD Million) by Type & Application, 2024–2034
- Table 25: Turkey Market Size (USD Million) by Type & Application, 2024–2034
- Table 26: Africa Market Size (USD Million) by Type & Application, 2024–2034
List of Figures
- Figure 1: Global Market Share by Type, 2024
- Figure 2: Global Market Share by Application, 2024
- Figure 3: North America Market Share by Type, 2024
- Figure 4: North America Market Share by Application, 2024
- Figure 5: U.S. Market Share by Type, 2024
- Figure 6: U.S. Market Share by Application, 2024
- Figure 7: Canada Market Share by Type, 2024
- Figure 8: Canada Market Share by Application, 2024
- Figure 9: Mexico Market Share by Type, 2024
- Figure 10: Mexico Market Share by Application, 2024
- Figure 11: Europe Market Share by Type, 2024
- Figure 12: Europe Market Share by Application, 2024
- Figure 13: Germany Market Share by Type, 2024
- Figure 14: Germany Market Share by Application, 2024
- Figure 15: France Market Share by Type, 2024
- Figure 16: France Market Share by Application, 2024
- Figure 17: UK Market Share by Type, 2024
- Figure 18: UK Market Share by Application, 2024
- Figure 19: Italy Market Share by Type, 2024
- Figure 20: Italy Market Share by Application, 2024
- Figure 21: Asia Pacific Market Share by Type, 2024
- Figure 22: Asia Pacific Market Share by Application, 2024
- Figure 23: China Market Share by Type, 2024
- Figure 24: China Market Share by Application, 2024
- Figure 25: Japan Market Share by Type, 2024
- Figure 26: Japan Market Share by Application, 2024
- Figure 27: India Market Share by Type, 2024
- Figure 28: India Market Share by Application, 2024
- Figure 29: South Korea Market Share by Type, 2024
- Figure 30: South Korea Market Share by Application, 2024
- Figure 31: Southeast Asia Market Share by Type, 2024
- Figure 32: Southeast Asia Market Share by Application, 2024
- Figure 33: Latin America Market Share by Type, 2024
- Figure 34: Latin America Market Share by Application, 2024
- Figure 35: Brazil Market Share by Type, 2024
- Figure 36: Brazil Market Share by Application, 2024
- Figure 37: Middle East & Africa Market Share by Type, 2024
- Figure 38: Middle East & Africa Market Share by Application, 2024
- Figure 39: GCC Countries Market Share by Type, 2024
- Figure 40: GCC Countries Market Share by Application, 2024
- Figure 41: Turkey Market Share by Type, 2024
- Figure 42: Turkey Market Share by Application, 2024
- Figure 43: Africa Market Share by Type, 2024
- Figure 44: Africa Market Share by Application, 2024

Kesiya Chacko is an accomplished market research professional with over 4+ years of experience in the healthcare industry, known for delivering actionable insights and strategic analysis that empower healthcare organizations to navigate complex, rapidly evolving markets.
Kesiya began her research career with Precedence Research, where she built a strong foundation in pharmaceutical and healthcare market analysis. Today, she plays an integral role at Towards Healthcare, contributing to in-depth, client-centric research initiatives. She also brings her expertise to Statifacts, supporting broader research functions with a focus on cross-sector healthcare trends and data interpretation.
Her commitment to high-quality analysis, combined with a strong grasp of regulatory and market dynamics, makes her a trusted contributor to healthcare firms seeking future-ready, data-backed decisions. Kesiya’s work spans the analysis of industry trends, competitive benchmarking, and evaluation of regulatory and innovation-driven shifts.
Latest posts by Kesiya Chacko (see all)
- Dental Implants Prosthetics Market Size to Surpass USD 26.95 Billion by 2034 - December 11, 2025
- Dental Software Market Size to Attain USD 5,228 Million by 2034 - December 11, 2025
- Dental Revenue Cycle Management Market Size to Reach USD 38.89 Billion by 2034 - December 11, 2025