Dental Glass Ionomer Fillings Market Size to Lead USD 2.08 Billion by 2034

Dental Glass Ionomer Fillings Market (By Product Type: Conventional Glass Ionomer, Resin-Modified Glass Ionomer, High-Strength Glass Ionomer, Glass Ionomer Cements; By Application Area ; By End Users ; By Distribution Channel ; By Material Composition ; By Region: North America, Europe, Asia Pacific, Latin America, Middle East and Africa) Industry Size, Share, Growth, Trends 2025 to 2034.

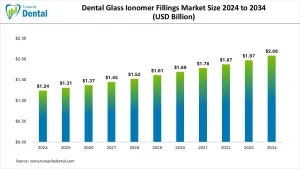
The dental glass ionomer fillings market was valued at USD 1.24 billion in 2024 and is expected to reach nearly USD 2.08 billion by 2034, expanding at a 5.30% CAGR, driven by rising restorative procedures and demand for durable, biocompatible materials.

Dental Glass Ionomer Fillings Market

What Factors Are Driving Growth in the Global Dental Glass Ionomer Fillings Market?
The dental glass ionomer fillings market consists of restorative materials composed of glass ionomer cements (GICs), which possess chemical adhesion to tooth structure, fluoride delivery, biocompatibility, and easy handling, which makes them necessary for atraumatic restorative treatment (ART), pediatric restorations, cervical lesions, and minimally invasive restorations. The increasing prevalence of caries, the growth of conservative dentistry, and the need for more affordable options to resin composites are driving demand in community dentistry and in programs focused on the health of the general population, which, in turn, are using oral health services.

However, the market is constrained by the fact that traditional GICs have limited mechanical strength, inferior aesthetics compared with high-tech restoratives, are prone to early moisture contamination, and require operator skill to avoid wear or marginal breakdown.

How Do Regional Trends Influence the Worldwide Adoption of Glass Ionomer Restoratives?
The dental glass ionomer fillings market is dominated by North America, driven by high awareness of preventive dentistry, widespread adoption of RMGICs in children’s clinics, and high usage of glass ionomers in interim restorations, core builds, and cervical lesions. The presence of dental research academies benefits the U.S. market by enabling more advanced product development channels and higher reimbursement for preventive or least-invasive restorative treatments.

Europe has a high market share, led by Germany, the U.K., France, Italy, and the Nordic countries, where ART procedures, fluoride-releasing restoratives, and public-health caries-management programs are experiencing steady adoption. Asia-Pacific has been the most rapidly expanding market due to the escalating burden of caries among children and adults, expanding dental school systems, and increased government support for community restoration initiatives in India, China, Thailand, Indonesia, Japan, and South Korea.

How Are AI and Emerging Technologies Transforming Diagnostics, Material Selection, and Outcomes in GIC Restorations?
The use of AI-driven innovations is improving the way clinicians plan, implement, and assess restorations made with glass ionomer materials. AI facilitates the detection of caries at early stages, the evaluation of lesion depth, and the prediction of restoration longevity, allowing dentists to select the best types of GIC in real time, based on risk scores. The digital integration of most workflows, including intraoral scanning, CBCT analytics, and the selection of high-viscosity GIC and RMGIC versus bioactive variants, is guided by the digital workflow.

Studies on biomimetic and bioactive GICs that can interact with dentin collagen, release therapeutic ions, and induce remineralization are progressing rapidly. There might be AI-

assisted restorative robots, AR assistance during placement, and sensors embedded in restorations to measure pH, microleakage, or wear patterns, making glass ionomer fillings into smart oral health-supporting biomaterials.

Dental Glass Ionomer Fillings Market Statical Scope

Reports Attributes Statistics
Market Size in 2024 USD 1.24 Billion
Market Size in 2025 USD 1.31 Billion
Market Size in 2031 USD 1.78 Billion
Market Size by 2034 USD 2.08 Billion
CAGR 2025 to 2034 5.30%
Base Year 2024
Forecast Period 2025 to 2034

What is Cosmetic Dentistry Market Size in 2024 to 2034

The global cosmetic dentistry market size was valued at USD 17.71 billion in 2024 and is projected to reach USD 22.89 billion by 2034, growing at a CAGR of 2.6%. This growth is driven by rising demand for aesthetic dental treatments, advancements in dental technology, and increasing awareness of dental health and appearance.

Cosmetic Dentistry Market

What is Teledentistry for Periodontics Market Size in 2024 to 2034

The global teledentistry for periodontics market size was valued at USD 181 million in 2024 and is expected to reach USD 1,811.07 million by 2034, growing at a robust CAGR of 25.9%. The surge is fueled by rising digital adoption in dental care, remote consultations, and patient accessibility.

Teledentistry for Periodontics Market

Dental Glass Ionomer Fillings Market Companies:

  • 3M ESPE
  • Dentsply Sirona
  • Envista Holdings
  • Mitsui Chemicals
  • Ivoclar Vivadent
  • Coltene
  • VOCO
  • Ultradent
  • GC Corporation

Dental Glass Ionomer Fillings Market Segmentation:

By Product Type

  • Conventional Glass Ionomer
  • Resin-Modified Glass Ionomer
  • High-Strength Glass Ionomer
  • Glass Ionomer Cements

By Distribution Channel

  • Online Sales
  • Retail Pharmacy
  • Direct Sales

By Application

  • Restorative Dentistry
  • Cavity Fillings
  • Luting Applications
  • Pedodontics
  • Orthodontics

By End-User

  • Dental Clinics
  • Dental Hospitals
  • Research Institutions
  • Dental Laboratories

By Material Composition

  • Powder and Liquid Combinations
  • Glass Particles
  • Polyacrylic Acid
  • Resin Additives

By Region

  • North America
  • Europe
  • Asia-Pacific
  • Latin America
  • Middle East and Africa

Global Market Size

Dental Glass Ionomer Fillings Market Size By Region 2025 to 2034 (USD Billion)

  By Region 2024 2025 2026 2027 2028 2029 2030 2031 2032 2033 2034
North America 372 383.83 392.57 397.84 403.01 448.16 469.24 496.1 558.31 557.67 469.3
Asia Pacific 434 487 554.69 596.79 665.99 705.07 749.05 796.85 843.06 947.06 870.17
Europe 310 318.73 345.86 360.2 346.71 370.61 394.77 428.56 505.16 534.56 669.11
LAMEA 124 116.16 81.81 93.96 108.82 81.49 77.35 58.49 67.8 64.38 69.71

Dental Glass Ionomer Fillings Market Size By Product Type 2025 to 2034 (USD Billion)

By Product Type 2024 2025 2026 2027 2028 2029 2030 2031 2032 2033 2034
Conventional Glass Ionomer     372.00     389.66     377.61     393.95     376.64     386.98     401.00     409.17     430.56     448.26     416.95
Resin-Modified Glass Ionomer     434.00     465.33     478.10     489.48     507.95     515.28     551.82     563.09     589.07     614.20     328.01
High-Strength Glass Ionomer     248.00     256.81     275.70     293.44     314.82     318.82     347.86     347.13     366.22     385.16     289.85
Glass Ionomer Cements     186.00     193.92     243.51     270.92     324.12     384.24     389.54     460.61     488.49     526.06     311.03

List of Table and Figure

List of Tables

  • Table 1: North America Dental Glass Ionomer Fillings Market Size, by Product Type, 2024–2034 (USD Billion)
  • Table 2: North America Dental Glass Ionomer Fillings Market Size, by Application Area, 2024–2034 (USD Billion)
  • Table 3: North America Dental Glass Ionomer Fillings Market Size, by End Users, 2024–2034 (USD Billion)
  • Table 4: North America Dental Glass Ionomer Fillings Market Size, by Distribution Channel, 2024–2034 (USD Billion)
  • Table 5: North America Dental Glass Ionomer Fillings Market Size, by Material Composition, 2024–2034 (USD Billion)
  • Table 6: U.S. Dental Glass Ionomer Fillings Market Size, by Product Type, 2024–2034 (USD Billion)
  • Table 7: U.S. Dental Glass Ionomer Fillings Market Size, by Application Area, 2024–2034 (USD Billion)
  • Table 8: U.S. Dental Glass Ionomer Fillings Market Size, by End Users, 2024–2034 (USD Billion)
  • Table 9: U.S. Dental Glass Ionomer Fillings Market Size, by Distribution Channel, 2024–2034 (USD Billion)
  • Table 10: U.S. Dental Glass Ionomer Fillings Market Size, by Material Composition, 2024–2034 (USD Billion)
  • Table 11: Canada Dental Glass Ionomer Fillings Market Size, by Product Type, 2024–2034 (USD Billion)
  • Table 12: Canada Dental Glass Ionomer Fillings Market Size, by Application Area, 2024–2034 (USD Billion)
  • Table 13: Canada Dental Glass Ionomer Fillings Market Size, by End Users, 2024–2034 (USD Billion)
  • Table 14: Canada Dental Glass Ionomer Fillings Market Size, by Distribution Channel, 2024–2034 (USD Billion)
  • Table 15: Canada Dental Glass Ionomer Fillings Market Size, by Material Composition, 2024–2034 (USD Billion)
  • Table 16: Mexico Dental Glass Ionomer Fillings Market Size, by Product Type, 2024–2034 (USD Billion)
  • Table 17: Mexico Dental Glass Ionomer Fillings Market Size, by Application Area, 2024–2034 (USD Billion)
  • Table 18: Mexico Dental Glass Ionomer Fillings Market Size, by End Users, 2024–2034 (USD Billion)
  • Table 19: Mexico Dental Glass Ionomer Fillings Market Size, by Distribution Channel, 2024–2034 (USD Billion)
  • Table 20: Mexico Dental Glass Ionomer Fillings Market Size, by Material Composition, 2024–2034 (USD Billion)
  • Table 21: Europe Dental Glass Ionomer Fillings Market Size, by Product Type, 2024–2034 (USD Billion)
  • Table 22: Europe Dental Glass Ionomer Fillings Market Size, by Application Area, 2024–2034 (USD Billion)
  • Table 23: Europe Dental Glass Ionomer Fillings Market Size, by End Users, 2024–2034 (USD Billion)
  • Table 24: Europe Dental Glass Ionomer Fillings Market Size, by Distribution Channel, 2024–2034 (USD Billion)
  • Table 25: Europe Dental Glass Ionomer Fillings Market Size, by Material Composition, 2024–2034 (USD Billion)
  • Table 26: Germany Dental Glass Ionomer Fillings Market Size, by Product Type, 2024–2034 (USD Billion)
  • Table 27: Germany Dental Glass Ionomer Fillings Market Size, by Application Area, 2024–2034 (USD Billion)
  • Table 28: Germany Dental Glass Ionomer Fillings Market Size, by End Users, 2024–2034 (USD Billion)
  • Table 29: Germany Dental Glass Ionomer Fillings Market Size, by Distribution Channel, 2024–2034 (USD Billion)
  • Table 30: Germany Dental Glass Ionomer Fillings Market Size, by Material Composition, 2024–2034 (USD Billion)
  • Table 31: France Dental Glass Ionomer Fillings Market Size, by Product Type, 2024–2034 (USD Billion)
  • Table 32: France Dental Glass Ionomer Fillings Market Size, by Application Area, 2024–2034 (USD Billion)
  • Table 33: France Dental Glass Ionomer Fillings Market Size, by End Users, 2024–2034 (USD Billion)
  • Table 34: France Dental Glass Ionomer Fillings Market Size, by Distribution Channel, 2024–2034 (USD Billion)
  • Table 35: France Dental Glass Ionomer Fillings Market Size, by Material Composition, 2024–2034 (USD Billion)
  • Table 36: U.K. Dental Glass Ionomer Fillings Market Size, by Product Type, 2024–2034 (USD Billion)
  • Table 37: U.K. Dental Glass Ionomer Fillings Market Size, by Application Area, 2024–2034 (USD Billion)
  • Table 38: U.K. Dental Glass Ionomer Fillings Market Size, by End Users, 2024–2034 (USD Billion)
  • Table 39: U.K. Dental Glass Ionomer Fillings Market Size, by Distribution Channel, 2024–2034 (USD Billion)
  • Table 40: U.K. Dental Glass Ionomer Fillings Market Size, by Material Composition, 2024–2034 (USD Billion)
  • Table 41: Italy Dental Glass Ionomer Fillings Market Size, by Product Type, 2024–2034 (USD Billion)
  • Table 42: Italy Dental Glass Ionomer Fillings Market Size, by Application Area, 2024–2034 (USD Billion)
  • Table 43: Italy Dental Glass Ionomer Fillings Market Size, by End Users, 2024–2034 (USD Billion)
  • Table 44: Italy Dental Glass Ionomer Fillings Market Size, by Distribution Channel, 2024–2034 (USD Billion)
  • Table 45: Italy Dental Glass Ionomer Fillings Market Size, by Material Composition, 2024–2034 (USD Billion)
  • Table 46: Asia-Pacific Dental Glass Ionomer Fillings Market Size, by Product Type, 2024–2034 (USD Billion)
  • Table 47: Asia-Pacific Dental Glass Ionomer Fillings Market Size, by Application Area, 2024–2034 (USD Billion)
  • Table 48: Asia-Pacific Dental Glass Ionomer Fillings Market Size, by End Users, 2024–2034 (USD Billion)
  • Table 49: Asia-Pacific Dental Glass Ionomer Fillings Market Size, by Distribution Channel, 2024–2034 (USD Billion)
  • Table 50: Asia-Pacific Dental Glass Ionomer Fillings Market Size, by Material Composition, 2024–2034 (USD Billion)
  • Table 51: China Dental Glass Ionomer Fillings Market Size, by Product Type, 2024–2034 (USD Billion)
  • Table 52: China Dental Glass Ionomer Fillings Market Size, by Application Area, 2024–2034 (USD Billion)
  • Table 53: China Dental Glass Ionomer Fillings Market Size, by End Users, 2024–2034 (USD Billion)
  • Table 54: China Dental Glass Ionomer Fillings Market Size, by Distribution Channel, 2024–2034 (USD Billion)
  • Table 55: China Dental Glass Ionomer Fillings Market Size, by Material Composition, 2024–2034 (USD Billion)
  • Table 56: Japan Dental Glass Ionomer Fillings Market Size, by Product Type, 2024–2034 (USD Billion)
  • Table 57: Japan Dental Glass Ionomer Fillings Market Size, by Application Area, 2024–2034 (USD Billion)
  • Table 58: Japan Dental Glass Ionomer Fillings Market Size, by End Users, 2024–2034 (USD Billion)
  • Table 59: Japan Dental Glass Ionomer Fillings Market Size, by Distribution Channel, 2024–2034 (USD Billion)
  • Table 60: Japan Dental Glass Ionomer Fillings Market Size, by Material Composition, 2024–2034 (USD Billion)
  • Table 61: India Dental Glass Ionomer Fillings Market Size, by Product Type, 2024–2034 (USD Billion)
  • Table 62: India Dental Glass Ionomer Fillings Market Size, by Application Area, 2024–2034 (USD Billion)
  • Table 63: India Dental Glass Ionomer Fillings Market Size, by End Users, 2024–2034 (USD Billion)
  • Table 64: India Dental Glass Ionomer Fillings Market Size, by Distribution Channel, 2024–2034 (USD Billion)
  • Table 65: India Dental Glass Ionomer Fillings Market Size, by Material Composition, 2024–2034 (USD Billion)
  • Table 66: South Korea Dental Glass Ionomer Fillings Market Size, by Product Type, 2024–2034 (USD Billion)
  • Table 67: South Korea Dental Glass Ionomer Fillings Market Size, by Application Area, 2024–2034 (USD Billion)
  • Table 68: South Korea Dental Glass Ionomer Fillings Market Size, by End Users, 2024–2034 (USD Billion)
  • Table 69: South Korea Dental Glass Ionomer Fillings Market Size, by Distribution Channel, 2024–2034 (USD Billion)
  • Table 70: South Korea Dental Glass Ionomer Fillings Market Size, by Material Composition, 2024–2034 (USD Billion)
  • Table 71: Southeast Asia Dental Glass Ionomer Fillings Market Size, 2024–2034 (Multiple Segments, USD Billion)
  • Table 72: Latin America Dental Glass Ionomer Fillings Market Size, by Product Type, 2024–2034 (USD Billion)
  • Table 73: Latin America Dental Glass Ionomer Fillings Market Size, by Application Area, 2024–2034 (USD Billion)
  • Table 74: Latin America Dental Glass Ionomer Fillings Market Size, by End Users, 2024–2034 (USD Billion)
  • Table 75: Latin America Dental Glass Ionomer Fillings Market Size, by Distribution Channel, 2024–2034 (USD Billion)
  • Table 76: Latin America Dental Glass Ionomer Fillings Market Size, by Material Composition, 2024–2034 (USD Billion)
  • Table 77: Brazil Dental Glass Ionomer Fillings Market Size, by Product Type, 2024–2034 (USD Billion)
  • Table 78: Brazil Dental Glass Ionomer Fillings Market Size, by Application Area, 2024–2034 (USD Billion)
  • Table 79: Brazil Dental Glass Ionomer Fillings Market Size, by End Users, 2024–2034 (USD Billion)
  • Table 80: Brazil Dental Glass Ionomer Fillings Market Size, by Distribution Channel, 2024–2034 (USD Billion)
  • Table 81: Brazil Dental Glass Ionomer Fillings Market Size, by Material Composition, 2024–2034 (USD Billion)
  • Table 82: Middle East & Africa Dental Glass Ionomer Fillings Market Size, by Product Type, 2024–2034 (USD Billion)
  • Table 83: Middle East & Africa Dental Glass Ionomer Fillings Market Size, by Application Area, 2024–2034 (USD Billion)
  • Table 84: Middle East & Africa Dental Glass Ionomer Fillings Market Size, by End Users, 2024–2034 (USD Billion)
  • Table 85: Middle East & Africa Dental Glass Ionomer Fillings Market Size, by Distribution Channel, 2024–2034 (USD Billion)
  • Table 86: Middle East & Africa Dental Glass Ionomer Fillings Market Size, by Material Composition, 2024–2034 (USD Billion)
  • Table 87: GCC Countries – Market Size by Product Type, 2024–2034 (USD Billion)
  • Table 88: GCC Countries – Market Size by Application Area, 2024–2034 (USD Billion)
  • Table 89: GCC Countries – Market Size by End Users, 2024–2034 (USD Billion)
  • Table 90: GCC Countries – Market Size by Distribution Channel, 2024–2034 (USD Billion)
  • Table 91: GCC Countries – Market Size by Material Composition, 2024–2034 (USD Billion)
  • Table 92: Turkey Dental Glass Ionomer Fillings Market Size, by Key Segments, 2024–2034 (USD Billion)
  • Table 93: Africa Dental Glass Ionomer Fillings Market Size, by Key Segments, 2024–2034 (USD Billion)

List of Figures

  • Figure 1: Dental Glass Ionomer Fillings Market Share, by Product Type, 2024 (%)
  • Figure 2: Dental Glass Ionomer Fillings Market Share, by Application Area, 2024 (%)
  • Figure 3: Dental Glass Ionomer Fillings Market Share, by End Users, 2024 (%)
  • Figure 4: Dental Glass Ionomer Fillings Market Share, by Distribution Channel, 2024 (%)
  • Figure 5: Dental Glass Ionomer Fillings Market Share, by Material Composition, 2024 (%)
  • Figure 6: Global Dental Glass Ionomer Fillings Market Forecast, 2024–2034 (USD Billion)
  • Figure 7: North America Market Share, by Country, 2024 (%)
  • Figure 8: Europe Market Share, by Country, 2024 (%)
  • Figure 9: Asia-Pacific Market Share, by Country, 2024 (%)
  • Figure 10: Latin America Market Share, by Country, 2024 (%)
  • Figure 11: Middle East & Africa Market Share, by Country, 2024 (%)
  • Figure 12: U.S. Dental Glass Ionomer Fillings Market Forecast, 2024–2034 (USD Billion)
  • Figure 13: Germany Market Forecast, 2024–2034 (USD Billion)
  • Figure 14: U.K. Market Forecast, 2024–2034 (USD Billion)
  • Figure 15: France Market Forecast, 2024–2034 (USD Billion)
  • Figure 16: China Market Forecast, 2024–2034 (USD Billion)
  • Figure 17: Japan Market Forecast, 2024–2034 (USD Billion)
  • Figure 18: India Market Forecast, 2024–2034 (USD Billion)
  • Figure 19: Brazil Market Forecast, 2024–2034 (USD Billion)
  • Figure 20: GCC Countries Market Forecast, 2024–2034 (USD Billion)
  • Figure 21: Africa Market Forecast, 2024–2034 (USD Billion)
Rohan Patil

Author

Scroll to Top