Dental Materials for Dental Restorations Market Size to Lead USD 13.69 Billion by 2034

Dental Materials for Dental Restorations Market (By Material Type: Composite Resins, Ceramics, Amalgam, Glass Ionomer Cement, Gold and Other Metals; By Application: Direct Restorations, Indirect Restorations, Crowns and Bridges, Inlays and Onlays, Veneers; By End User ; By Form ; By Region: North America, Europe, Asia Pacific, Latin America, Middle East and Africa) Industry Size, Share, Growth, Trends 2025 to 2034.

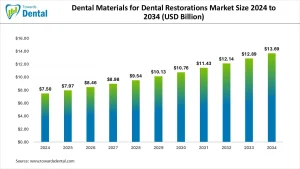
The dental materials for restorations market was valued at USD 7.5 billion in 2024 and is expected to reach nearly USD 13.69 billion by 2034, expanding at a 6.30% CAGR, driven by rising restorative procedures and advanced biomaterial adoption.

Dental Materials for Dental Restorations Marke

Why Is There High Demand in the Dental Materials for Dental Restorations Market?
Demand is increasing because restorative dentistry remains one of the most frequently performed dental services worldwide. The World Health Organization reported in 2022 that untreated dental caries affects approximately 2.5 billion people globally, making restorative interventions essential for maintaining oral function and aesthetics. As clinicians aim to preserve natural tooth structure, materials such as composite resins, glass ionomers, ceramics, bioactive materials and hybrid composites are being adopted at a faster pace. Patients also show a strong preference for natural-looking restorations, increasing the use of tooth-colored materials that offer both strength and aesthetic appeal.

The shift toward minimally invasive dentistry contributes significantly to the market’s expansion. Modern restorations rely on adhesive materials that support conservative cavity preparation and long-term bonding. High-strength ceramics and lithium disilicate materials remain preferred for crowns and onlays. At the same time, composite resins dominate direct restorations due to improvements in wear resistance, handling properties and shade-matching capabilities. Growth of dental insurance, expansion of private dental clinics and rising awareness of preventive and cosmetic dentistry further support global demand.

What Are the Obstacles Holding Back Growth in the Dental Materials for Dental Restorations Market?
Despite strong adoption, several challenges restrict broader market growth. High costs associated with premium ceramic blocks, zirconia, and advanced bonding systems limit access in low- and middle-income regions. Many developing countries still rely heavily on amalgam due to affordability, despite global efforts to phase down mercury-containing materials under the Minamata Convention. Limited clinician training in advanced composite layering techniques, ceramic handling and digital workflows can also reduce treatment quality and slow adoption of newer materials.

Inconsistencies in regulatory frameworks add further obstacles. Restorative materials must comply with strict biocompatibility and safety standards, which lengthen development cycles for manufacturers. Longevity concerns also influence patients’ decisions, as direct composite restorations may require more frequent maintenance than ceramic alternatives. Supply chain limitations in certain regions affect access to high-quality bonding agents, impression materials, and CAD/CAM-compatible blocks, slowing market penetration.

What Does the Regional Landscape of the Dental Materials for Dental Restorations Market Look Like?
North America leads the global market due to its high volume of restorative procedures, strong dental insurance coverage and widespread use of advanced ceramic and composite systems. Dental clinics and laboratories in the United States and Canada frequently adopt cutting-edge materials that support digital workflows, including high-translucency zirconia, resin-based nano-hybrids and bioactive composites.

Europe follows closely, supported by strong adherence to preventive dentistry, high training standards among clinicians and well-regulated dental-material markets. Countries such as

Germany, France, the United Kingdom and the Nordic region prioritise durable, aesthetic restorations and advanced bonding techniques, promoting steady demand for premium materials.

Asia Pacific is the fastest-growing region, driven by rising dental tourism, expanding private dental hospitals and increasing awareness of cosmetic dentistry. China, India, Japan and South Korea are experiencing rapid growth in restorative treatments as middle-class populations expand and digital CAD/CAM systems become more widely accessible. Latin America shows consistent progress, particularly in Brazil and Mexico, where private dental networks are modernising. The Middle East and Africa are growing gradually as private clinics invest in modern dental materials, though affordability and access remain limiting factors.

How Is Technology Changing the Dental Materials for Dental Restorations Market?
Technology is transforming material performance, design precision and clinical workflows. CAD/CAM systems enable accurate milling of zirconia, lithium disilicate, and hybrid ceramic blocks, improving restoration fit, aesthetics, and longevity. Digital impressions reduce distortions associated with traditional molds, enhancing the performance of restorative materials.

Bioactive materials are also gaining popularity. These materials release fluoride, calcium and phosphate ions to promote remineralisation and improve tooth health. Nano-hybrid and nano-ceramic composites offer superior polishability, wear resistance and color stability, supporting better clinical outcomes. AI-driven diagnostic tools assist in cavity detection, material selection and treatment planning, allowing clinicians to match restorative materials to patient-specific risk profiles. As digital workflows expand, material science innovations continue to elevate the quality, durability and aesthetics of modern dental restorations.

Dental Materials for Dental Restorations Market Statical Scope

Reports Attributes Statistics
Market Size in 2024 USD 7.5 Billion
Market Size in 2025 USD 7.97 Billion
Market Size in 2031 USD 11.43 Billion
Market Size by 2034 USD 13.69 Billion
CAGR 2025 to 2034 6.30%
Base Year 2024
Forecast Period 2025 to 2034

What is Dental Material Market Size in 2024 to 2034?

The global dental material market was valued at USD 6.51 bn in 2024 and is forecast to reach about USD 11.44 bn by 2034, expanding at a 5.8% CAGR, supported by rising restorative procedures and advanced biomaterials adoption.

Dental Material Market

What is Dental Laboratory Service Market Size in 2024 to 2034?

The dental laboratory service market was valued at USD 1,822 million in 2024 and is forecasted to reach USD 3,485 million by 2034, growing at a CAGR of 6.7%. This growth is attributed to the rising demand for advanced dental solutions and technological innovations in dental labs.

Dental Laboratory Service Market

Dental Materials for Dental Restorations Market Companies:

  • 3M Company
  • Dentsply Sirona Inc.
  • Ivoclar Vivadent AG
  • Danaher Corporation
  • GC Corporation
  • Kuraray Noritake Dental Inc.
  • Septodont
  • Coltene Holding AG
  • Straumann Holding AG
  • Henry Schein Inc.
  • Zimmer Biomet Holdings Inc.

Dental Materials for Dental Restorations Market Segmentation:

By Material Type

  • Composite Resins
  • Ceramics
  • Amalgam
  • Glass Ionomer Cement
  • Gold and Other Metals

By Application

  • Direct Restorations
  • Indirect Restorations
  • Crowns and Bridges
  • Inlays and Onlays
  • Veneers

By End-User

  • Private Dental Clinics
  • Dental Hospitals
  • Dental Schools and Universities
  • Research and Development Facilities

By End User

  • Dental Hospitals and Clinics
  • Dental Laboratories
  • Dental Academic and Research Institutes
  • Dental Retail Stores

By Form

  • Powder
  • Liquid
  • Paste
  • Capsules

By Region

  • North America
  • Europe
  • Asia-Pacific
  • Latin America
  • Middle East and Africa

Global Market Size

Dental Materials for Dental Restorations Market Size By Region 2025 to 2034 (USD Billion)

By Region 2024 2025 2026 2027 2028 2029 2030 2031 2032 2033 2034
North America  2,250.00  2,383.78  2,525.48  2,675.58  2,834.56  3,002.96  3,181.33  3,370.25  3,570.35  3,782.28  4,006.75
Asia Pacific  2,625.00  2,822.26  3,033.97  3,261.14  3,504.90  3,766.42  4,046.99  4,347.96  4,670.79  5,017.04  5,388.38
Europe  1,875.00  1,985.15  2,101.74  2,225.14  2,355.75  2,493.98  2,640.28  2,795.12  2,958.98  3,132.40  3,315.93
LAMEA     750.00     781.30     813.58     846.82     881.01     916.16     952.23     989.22  1,027.09  1,065.80  1,105.31

Dental Materials for Dental Restorations Market Size By Product Type 2025 to 2034 (USD Billion)

By Material Type 2024 2025 2026 2027 2028 2029 2030 2031 2032 2033 2034
Composite Resins  2,625.00  2,830.24  3,050.92  3,288.17  3,543.20  3,817.32  4,111.92  4,428.48  4,768.61  5,134.02  5,526.55
Ceramics  1,875.00  2,009.07  2,152.59  2,306.22  2,470.67  2,646.68  2,835.06  3,036.67  3,252.44  3,483.34  3,730.42
Amalgam  1,125.00  1,116.15  1,101.72  1,081.04  1,053.38  1,017.95     973.88     920.20     855.90     779.85     690.82
Glass Ionomer Cement  1,125.00  1,219.79  1,322.06  1,432.38  1,551.35  1,679.62  1,817.90  1,966.94  2,127.53  2,300.56  2,486.95
Gold & Other Metals     750.00     797.25     847.48     900.87     957.62  1,017.95  1,082.08  1,150.25  1,222.72  1,299.75  1,381.64

List of Table and Figure

List of Tables

  • Table 1: North America Dental Materials for Dental Restorations Market Size, by Material Type, 2024–2034 (USD Billion)
  • Table 2: North America Dental Materials for Dental Restorations Market Size, by Application, 2024–2034 (USD Billion)
  • Table 3: North America Dental Materials for Dental Restorations Market Size, by End User, 2024–2034 (USD Billion)
  • Table 4: North America Dental Materials for Dental Restorations Market Size, by Form, 2024–2034 (USD Billion)
  • Table 5: U.S. Market Size, by Material Type, 2024–2034 (USD Billion)
  • Table 6: U.S. Market Size, by Application, 2024–2034 (USD Billion)
  • Table 7: U.S. Market Size, by End User, 2024–2034 (USD Billion)
  • Table 8: U.S. Market Size, by Form, 2024–2034 (USD Billion)
  • Table 9: Canada Market Size, by Material Type, 2024–2034 (USD Billion)
  • Table 10: Canada Market Size, by Application, 2024–2034 (USD Billion)
  • Table 11: Canada Market Size, by End User, 2024–2034 (USD Billion)
  • Table 12: Canada Market Size, by Form, 2024–2034 (USD Billion)
  • Table 13: Mexico Market Size, by Material Type, 2024–2034 (USD Billion)
  • Table 14: Mexico Market Size, by Application, 2024–2034 (USD Billion)
  • Table 15: Mexico Market Size, by End User, 2024–2034 (USD Billion)
  • Table 16: Mexico Market Size, by Form, 2024–2034 (USD Billion)
  • Table 17: Europe Market Size, by Material Type, 2024–2034 (USD Billion)
  • Table 18: Europe Market Size, by Application, 2024–2034 (USD Billion)
  • Table 19: Europe Market Size, by End User, 2024–2034 (USD Billion)
  • Table 20: Europe Market Size, by Form, 2024–2034 (USD Billion)
  • Table 21: Germany Market Size, by Material Type, 2024–2034 (USD Billion)
  • Table 22: Germany Market Size, by Application, 2024–2034 (USD Billion)
  • Table 23: Germany Market Size, by End User, 2024–2034 (USD Billion)
  • Table 24: Germany Market Size, by Form, 2024–2034 (USD Billion)
  • Table 25: U.K. Market Size, by Material Type, 2024–2034 (USD Billion)
  • Table 26: U.K. Market Size, by Application, 2024–2034 (USD Billion)
  • Table 27: U.K. Market Size, by End User, 2024–2034 (USD Billion)
  • Table 28: U.K. Market Size, by Form, 2024–2034 (USD Billion)
  • Table 29: France Market Size, by Material Type, 2024–2034 (USD Billion)
  • Table 30: France Market Size, by Application, 2024–2034 (USD Billion)
  • Table 31: France Market Size, by End User, 2024–2034 (USD Billion)
  • Table 32: France Market Size, by Form, 2024–2034 (USD Billion)
  • Table 33: Italy Market Size, by Material Type, 2024–2034 (USD Billion)
  • Table 34: Italy Market Size, by Application, 2024–2034 (USD Billion)
  • Table 35: Italy Market Size, by End User, 2024–2034 (USD Billion)
  • Table 36: Italy Market Size, by Form, 2024–2034 (USD Billion)
  • Table 37: Rest of Europe Market Size, by Material Type, 2024–2034 (USD Billion)
  • Table 38: Rest of Europe Market Size, by Application, 2024–2034 (USD Billion)
  • Table 39: Rest of Europe Market Size, by End User, 2024–2034 (USD Billion)
  • Table 40: Rest of Europe Market Size, by Form, 2024–2034 (USD Billion)
  • Table 41: Asia-Pacific Market Size, by Material Type, 2024–2034 (USD Billion)
  • Table 42: Asia-Pacific Market Size, by Application, 2024–2034 (USD Billion)
  • Table 43: Asia-Pacific Market Size, by End User, 2024–2034 (USD Billion)
  • Table 44: Asia-Pacific Market Size, by Form, 2024–2034 (USD Billion)
  • Table 45: China Market Size, by Material Type, 2024–2034 (USD Billion)
  • Table 46: China Market Size, by Application, 2024–2034 (USD Billion)
  • Table 47: China Market Size, by End User, 2024–2034 (USD Billion)
  • Table 48: China Market Size, by Form, 2024–2034 (USD Billion)
  • Table 49: Japan Market Size, by Material Type, 2024–2034 (USD Billion)
  • Table 50: Japan Market Size, by Application, 2024–2034 (USD Billion)
  • Table 51: Japan Market Size, by End User, 2024–2034 (USD Billion)
  • Table 52: Japan Market Size, by Form, 2024–2034 (USD Billion)
  • Table 53: South Korea Market Size, by Material Type, 2024–2034 (USD Billion)
  • Table 54: South Korea Market Size, by Application, 2024–2034 (USD Billion)
  • Table 55: South Korea Market Size, by End User, 2024–2034 (USD Billion)
  • Table 56: South Korea Market Size, by Form, 2024–2034 (USD Billion)
  • Table 57: India Market Size, by Material Type, 2024–2034 (USD Billion)
  • Table 58: India Market Size, by Application, 2024–2034 (USD Billion)
  • Table 59: India Market Size, by End User, 2024–2034 (USD Billion)
  • Table 60: India Market Size, by Form, 2024–2034 (USD Billion)
  • Table 61: Southeast Asia Market Size, by Material Type, 2024–2034 (USD Billion)
  • Table 62: Southeast Asia Market Size, by Application, 2024–2034 (USD Billion)
  • Table 63: Southeast Asia Market Size, by End User, 2024–2034 (USD Billion)
  • Table 64: Southeast Asia Market Size, by Form, 2024–2034 (USD Billion)
  • Table 65: Latin America Market Size, by Material Type, 2024–2034 (USD Billion)
  • Table 66: Latin America Market Size, by Application, 2024–2034 (USD Billion)
  • Table 67: Latin America Market Size, by End User, 2024–2034 (USD Billion)
  • Table 68: Latin America Market Size, by Form, 2024–2034 (USD Billion)
  • Table 69: Brazil Market Size, by Material Type, 2024–2034 (USD Billion)
  • Table 70: Brazil Market Size, by Application, 2024–2034 (USD Billion)
  • Table 71: Brazil Market Size, by End User, 2024–2034 (USD Billion)
  • Table 72: Brazil Market Size, by Form, 2024–2034 (USD Billion)
  • Table 73: Rest of Latin America Market Size, by Material Type, 2024–2034 (USD Billion)
  • Table 74: Rest of Latin America Market Size, by Application, 2024–2034 (USD Billion)
  • Table 75: Rest of Latin America Market Size, by End User, 2024–2034 (USD Billion)
  • Table 76: Rest of Latin America Market Size, by Form, 2024–2034 (USD Billion)
  • Table 77: Middle East & Africa Market Size, by Material Type, 2024–2034 (USD Billion)
  • Table 78: Middle East & Africa Market Size, by Application, 2024–2034 (USD Billion)
  • Table 79: Middle East & Africa Market Size, by End User, 2024–2034 (USD Billion)
  • Table 80: Middle East & Africa Market Size, by Form, 2024–2034 (USD Billion)
  • Table 81: GCC Market Size, by Material Type, 2024–2034 (USD Billion)
  • Table 82: GCC Market Size, by Application, 2024–2034 (USD Billion)
  • Table 83: GCC Market Size, by End User, 2024–2034 (USD Billion)
  • Table 84: GCC Market Size, by Form, 2024–2034 (USD Billion)
  • Table 85: Turkey Market Size, by Material Type, 2024–2034 (USD Billion)
  • Table 86: Turkey Market Size, by Application, 2024–2034 (USD Billion)
  • Table 87: Turkey Market Size, by End User, 2024–2034 (USD Billion)
  • Table 88: Turkey Market Size, by Form, 2024–2034 (USD Billion)
  • Table 89: Africa Market Size, by Material Type, 2024–2034 (USD Billion)
  • Table 90: Africa Market Size, by Application, 2024–2034 (USD Billion)
  • Table 91: Africa Market Size, by End User, 2024–2034 (USD Billion)
  • Table 92: Africa Market Size, by Form, 2024–2034 (USD Billion)

List of Figures

  • Figure 1: Dental Materials for Dental Restorations Market Share, by Material Type, 2024 (%)
  • Figure 2: Market Share, by Application, 2024 (%)
  • Figure 3: Market Share, by End User, 2024 (%)
  • Figure 4: Market Share, by Form, 2024 (%)
  • Figure 5: Global Market Forecast, 2024–2034 (USD Billion)
  • Figure 6: North America Market Share, by Country, 2024 (%)
  • Figure 7: Europe Market Share, by Country, 2024 (%)
  • Figure 8: Asia-Pacific Market Share, by Country, 2024 (%)
  • Figure 9: Latin America Market Share, by Country, 2024 (%)
  • Figure 10: Middle East & Africa Market Share, by Country, 2024 (%)
  • Figure 11: U.S. Market Forecast, 2024–2034 (USD Billion)
  • Figure 12: Germany Market Forecast, 2024–2034 (USD Billion)
  • Figure 13: U.K. Market Forecast, 2024–2034 (USD Billion)
  • Figure 14: France Market Forecast, 2024–2034 (USD Billion)
  • Figure 15: Italy Market Forecast, 2024–2034 (USD Billion)
  • Figure 16: China Market Forecast, 2024–2034 (USD Billion)
  • Figure 17: Japan Market Forecast, 2024–2034 (USD Billion)
  • Figure 18: India Market Forecast, 2024–2034 (USD Billion)
  • Figure 19: Brazil Market Forecast, 2024–2034 (USD Billion)
  • Figure 20: GCC Market Forecast, 2024–2034 (USD Billion)
  • Figure 21: Africa Market Forecast, 2024–2034 (USD Billion)
Rohan Patil

Author

Scroll to Top